PinnedShachee SwadiainTowards Data ScienceThe 5 Most Important Principles of Data Visualization“Above all else, show the data.” — Edward TufteFeb 8, 20214Feb 8, 20214
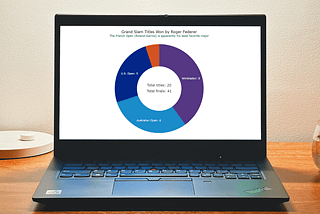
Shachee SwadiainLevel Up CodingCreating a Donut Chart with JavaScriptLearn how you can easily build cool interactive JS-based donut charts while visualizing Federer’s Grand Slam title tally step-by-step.Jun 11, 2023Jun 11, 2023
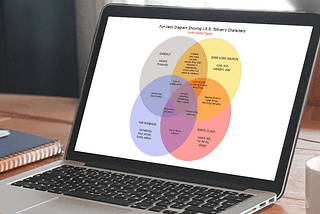
Shachee SwadiainBootcampHow to create a Venn diagram using JavaScriptThis tutorial provides step-by-step instructions on how anyone can easily build a cool interactive Venn diagram with JavaScript.Feb 22, 2023Feb 22, 2023
Shachee SwadiainBetter ProgrammingBuild a Stock Chart Using AnyChart JavaScript LibraryA step by step tutorial for building an interactive stock chart that displays the price of Tesla over the yearsJan 4, 20221Jan 4, 20221
Shachee SwadiainLevel Up CodingHow to Create a Circle Packing Chart Using JavaScriptA clear, step-by-step guide for building an interactive JS Circle Packing Chart to visualize the top 100 most streamed songs on Spotify.Jan 3, 20221Jan 3, 20221
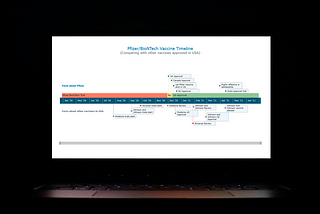
Shachee SwadiainNightingaleCreating Interactive Timelines with JavaScriptA step-by-step guide to visualizing the development of COVID-19 vaccinesMay 18, 20212May 18, 20212
Shachee SwadiainPrism & PenHeartening Story About Love With a Surprise Ending!Prism of possibilitiesApr 30, 20213Apr 30, 20213
Shachee SwadiainBe UniqueWit over WhiteA heart-warming story of my grand-parents from the 1930sJan 15, 20211Jan 15, 20211
Shachee SwadiainTowards Data ScienceHow I Created a Sunburst Chart Using JavaScript to Visualize Covid-19 DataA step-by-step tutorial on building interactive JS sunburst charts with easeDec 3, 20202Dec 3, 20202